
The bullet holes on a returning bomber mark the places where a plane can be shot and still fly home. During the Second World War, analysts studying aircraft back from missions over Europe saw damage clustered on the wings and fuselage and comparatively little around the engines — which made reinforcing the wings and fuselage look like the obvious move. The statistician Abraham Wald is credited with the reversal that made this story famous: the data comes only from survivors. The planes hit in the engine are missing from your airfield precisely because they are at the bottom of the English Channel.
This is survivorship bias, and once you can see it, it is everywhere — in war stories, investment brochures and startup mythology. In this paper we tell the real version of the Wald story, then do the small amount of maths that makes the trap precise.
Wald really did work on exactly this problem, for the Statistical Research Group at Columbia University, which did classified applied mathematics for the US military. In 1943 he wrote a series of memoranda, A Method of Estimating Plane Vulnerability Based on Damage of Survivors — a rigorous method for estimating the probability that a hit in each part of the aircraft brings it down, using only the damage recorded on planes that returned [1][2].
The theatrical version — Wald glancing at a diagram of bullet holes and declaring "armour where the holes aren't" — is a popular retelling, and there is no evidence the famous dotted-aeroplane picture ever sat on his desk. But the folklore compresses his actual insight faithfully: the returning planes are a biased sample, and Wald's contribution was to correct for that bias mathematically rather than merely point at it.
The mathematics of the missing planes
The trap, stated precisely: you want the distribution of hits over all planes, but you can only observe hits given that the plane returned — a conditional distribution. The filter (survival) is correlated with the very thing you are measuring (where the hit landed), so the sample lies to you in a systematic direction.
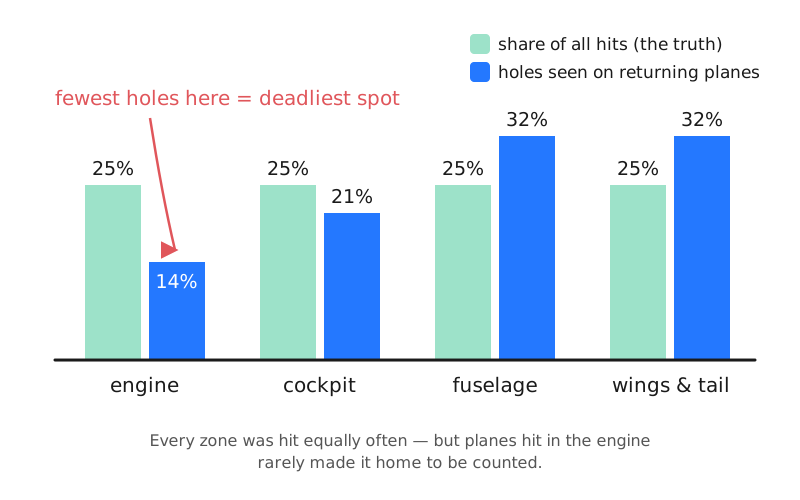
A toy model makes it vivid. Send out 200 bombers, each taking one hit, spread evenly: 50 in the engine, 50 in the cockpit, 50 in the fuselage, 50 in the wings and tail. Suppose the chance of making it home is 40% after an engine hit, 60% after a cockpit hit, and 90% after a hit to the fuselage or the wings. Then the returning fleet contains
Now walk the airfield and tally the holes. Engine hits make up of what you see, while fuselage and wing hits make up each — even though every zone was hit equally often. The engine looks like the safest place on the aircraft exactly because it is the deadliest.
Dead funds tell no tales
The same filter runs the investment industry. Mutual funds that perform badly get quietly closed or merged away, so "the average return of funds you can buy today" is an average over survivors.
A miniature example: ten funds post ten-year annualised returns of 12, 10, 9, 8, 8, 7, 6, 3, −2 and −6 percent. The true average is . Now let the worst three be liquidated — as loser funds routinely are — and recompute the average over the seven survivors: . The industry just gained 3 percentage points a year of pure statistical fiction, without a single fund improving. This is not only a toy effect: Malkiel, studying US equity funds from 1971 to 1991, found that ignoring dead funds inflated average reported returns by well over a percentage point per year [3]. "Every famous founder dropped out of college" is the same fallacy on one hit and no denominator — the dropouts who failed never got profiled.
What never made it into the data
Survivorship bias is what happens when you mistake for : the sample you can see has been filtered by an outcome that is correlated with the thing you are measuring. Wald's genius was not the slogan but the discipline — he modelled the filter itself and recovered the missing planes from the shape of their absence. The practical habit is a single question asked early: what data never made it into this dataset? It is the same discipline that makes a crowd estimate trustworthy only when you know who got to answer — see the wisdom of crowds — and that lets accountants catch doctored books by knowing what unfiltered data should look like in Benford's law.
References:
[1] Abraham Wald, A Method of Estimating Plane Vulnerability Based on Damage of Survivors (Statistical Research Group memoranda, 1943; reprinted by the Center for Naval Analyses, CRC 432, 1980).
[2] Marc Mangel and Francisco J. Samaniego, "Abraham Wald's Work on Aircraft Survivability," Journal of the American Statistical Association 79 (1984), 259–267.
[3] Burton G. Malkiel, "Returns from Investing in Equity Mutual Funds 1971 to 1991," Journal of Finance 50 (1995), 549–572.
Note: The bomber survival rates in the toy model above are illustrative, chosen to make the arithmetic clean; Wald's memoranda estimate the real vulnerability parameters from the observed damage data.