
In 1973, the University of California, Berkeley admitted about 44% of its male applicants and only 35% of its female applicants — a gap so large the university feared a discrimination lawsuit. So statisticians Bickel, Hammel and O'Connell went through the admissions data department by department, looking for the culprits. They found something stranger than bias: in most individual departments, women were admitted at equal or higher rates than men [1].
Both tables of numbers are correct. Nothing is miscounted. This is Simpson's paradox: a trend that holds in every subgroup can reverse when the subgroups are combined. In this paper we work through the real Berkeley numbers, watch the reversal happen with nothing but weighted averages, and ask the uncomfortable question — which table should we believe?
Two reversals: Berkeley and kidney stones
Campus-wide, 8,442 men and 4,321 women applied to graduate study in autumn 1973. Roughly 44% of the men and 35% of the women were admitted. Here are the six largest departments, which Bickel and colleagues used to show what was really going on (admitted/applied, rate in brackets):
- Department A — men: 512/825 (62%); women: 89/108 (82%)
- Department B — men: 353/560 (63%); women: 17/25 (68%)
- Department C — men: 120/325 (37%); women: 202/593 (34%)
- Department D — men: 138/417 (33%); women: 131/375 (35%)
- Department E — men: 53/191 (28%); women: 94/393 (24%)
- Department F — men: 22/373 (6%); women: 24/341 (7%)
In four of the six departments, women's admission rate is higher. In the other two it is close. Yet pool all six together and the totals are: men , women . The gap reappears out of nowhere.
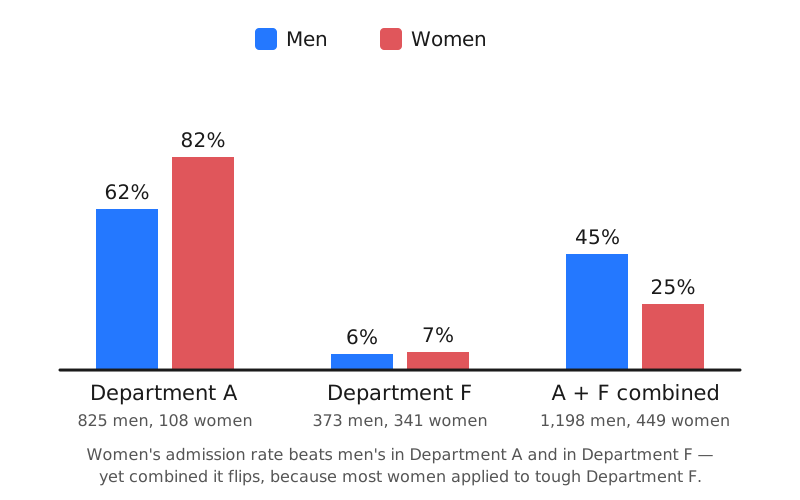
Strip it down to just departments A and F, using the real figures. Women out-perform men in both:
- Department A admits 62% of men and 82% of women.
- Department F admits 6% of men and 7% of women.
Now combine them. The men: 825 of 1,198 applied to easy-going Department A, so their overall rate is dragged up towards 62%:
The women: 341 of 449 applied to brutal Department F, so their overall rate is dragged down towards 7%:
Women win both departments and lose the total, 25% to 45%. No arithmetic crime has been committed: an overall rate is a weighted average of the department rates, and the two groups carry completely different weights. Men mostly applied to departments that admitted most applicants; women mostly applied to departments that rejected most applicants. The "lurking variable" — which department you applied to — was doing all the work.
The paradox is not a quirk of admissions data. A famous 1986 study compared two treatments for kidney stones [2]. For small stones, open surgery succeeded in 81/87 cases (93%) versus 234/270 (87%) for the keyhole procedure. For large stones, open surgery won again: 192/263 (73%) versus 55/80 (69%). But pooled together, open surgery scores 273/350 (78%) while the keyhole procedure scores 289/350 (83%) — the treatment that loses in both subgroups wins overall.
The lurking variable is severity: doctors sent the difficult, large-stone cases to open surgery and the easy ones to the keyhole procedure. Open surgery's average is weighed down by the hard cases it was trusted with.
So which number is the truth?
Here is the honest part: neither view is automatically right. The rule is not "always disaggregate" — it depends on the causal structure of the data.
For the kidney stones, severity influences both the treatment chosen and the outcome, so comparing within severity groups removes that distortion: the per-group numbers are the fair comparison, and open surgery really was performing better on like-for-like cases. For Berkeley, the department-level view answers the question "were admissions offices discriminating?" — and Bickel's answer was essentially no. But the aggregate 44%-vs-35% gap still reflected something real one causal step earlier: why were women disproportionately applying to the most competitive, most underfunded departments? The paradox does not tell you which question to ask; it only punishes you for not knowing which one you asked. Aggregated data can mislead in other sneaky ways too — the same lesson sits at the heart of the false positive paradox.
Why the causal story decides
Simpson's paradox is not a paradox of arithmetic — weighted averages with different weights can order themselves however they like. It is a paradox of interpretation: the numbers alone, however accurate, cannot tell you whether to trust the parts or the whole. That requires knowing how the data came to be — the causal story behind the table. A treatment can genuinely work for men and work for women yet "fail for people", and the moment you can explain why, the paradox dissolves.
References:
[1] P. J. Bickel, E. A. Hammel and J. W. O'Connell, "Sex Bias in Graduate Admissions: Data from Berkeley," Science 187 (1975), 398–404.
[2] C. R. Charig, D. R. Webb, S. R. Payne and J. E. A. Wickham, "Comparison of treatment of renal calculi by open surgery, percutaneous nephrolithotomy, and extracorporeal shockwave lithotripsy," British Medical Journal 292 (1986), 879–882.
[3] Judea Pearl and Dana Mackenzie, The Book of Why (Basic Books, New York, 2018).
Note: Admission rates are rounded to the nearest percent; the six-department table follows Bickel et al., who anonymised the departments.